
The beginner's guide to marketing mix modeling
A practical guide to understanding, building, and scaling your first Marketing Mix Model using Google Meridian.
As your marketing efforts expand across multiple platforms and budgets keep growing, every company eventually asks:
How much revenue is truly being driven by our marketing efforts?
If you’ve hit this point, you know how tough it is to get a clear answer. Many marketers dive into attribution models hoping to calculate ROI, only to end up disappointed.
Attribution models serve a different purpose, and with cookie consent policies, GDPR, and the decline of first-party data, they’ve become less reliable than ever. So how do we approach this problem?
The answer is: Marketing Mix Modeling!
What is Marketing Mix Modeling (MMM)
I’m not going to overcomplicate this. Google already gave us a good definition of what MMM is.
Media Mix Modeling is a statistical analysis technique that measures the impact of marketing campaigns and activities to guide budget planning decisions and improve overall media effectiveness.
In short, it is a way of correlating spend to revenue instead of looking at what touchpoints caused the revenue.
It is a measurement technique originally developed in the 1950s for retail businesses but has recently made a comeback in digital marketing.
At its core, MMM helps answer the million-dollar question: If I increase my investment in Facebook Ads by X, how much will my revenue increase?
One thing that kept confusing me about MMM is the term “Marketing Mix”. I’m mostly self thought and haven’t studied marketing at the university, so I didn’t know the term. But it’s crucial to really getting what MMM means.
What is a Marketing Mix
The term “Marketing Mix” comes from early marketing theory. In 1948, Harvard professor James Culliton described marketers as “mixers of ingredients” — sometimes following a recipe, sometimes inventing new ones.
By the 1960s, Edmund Jerome McCarthy introduced the now-famous 4 Ps of Marketing.
The four Ps of marketing: Place, Promotion, Product, Price
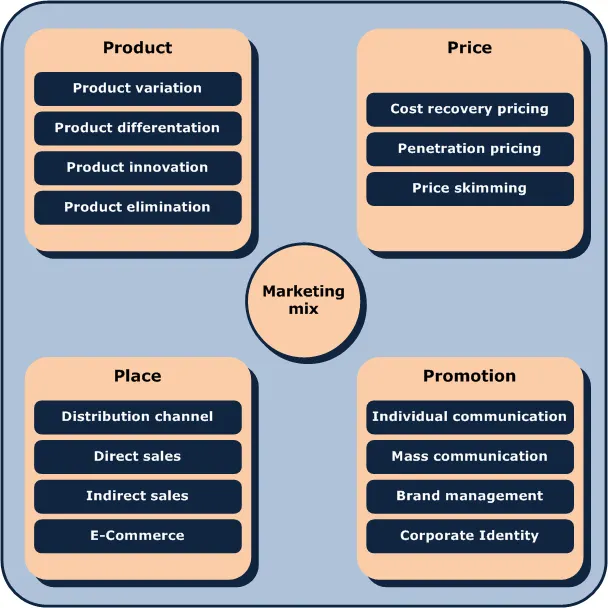
Marketing Mix Modeling, then, is simply a way to measure how these elements (particularly Promotion, Price, and Place), impact sales.
MMM measures how effective your marketing mix is at driving revenue.
Why build a Marketing Mix Model
Although MMM existed long before e-commerce, it’s become highly relevant in digital marketing. Here’s why:
Direct correlation between spend and revenue
- MMM is designed to answer the exact question every CMO asks: What’s the ROI of my ad spend?
- Less dependent on first-party data: MMM relies on statistical patterns, not perfect data. Losing some GA4 tracking data due to cookie banners? No problem, MMM is resilient.
- Accounts for all marketing efforts: Paid ads, newsletters, TV, website updates, even inventory size can be used to train an MMM model.
- Works for third-party stores - Selling on Amazon, Etsy, or Shopify? You can still run MMM without owning the full stack of first-party data.
Marketing mix modeling vs attribution modeling
It deffinitely took me some time to understand what the benefit of Marketing Mix Models comparing to Attribution models is. Often times they are used for the same purpose; defining marketing budgets. But while they are interpreted for similar results, the actual data they communicate to use, and the method we use to build them, is like comparing apples and motorbikes.
While attribution models are great at well… attributing conversions to a specific marketing effort, they don’t tell us what the driver for the actual conversion was.
This concept is quite hard to wrap your head around, but it gets simpler with this example.
Imagine you just started a webshop that sells keyhcains. You did your market research well, you did your SEO homework and you post daily on Instagram. All of these efforts are bringing you an average of 100 sales/day.
You decide to put some money in Google Ads and launch a search campaign hoping to drive even more customers to your website.
After a week you again open up your GA4 dashboard to check how your campaign is performing. The numbers look great. 20% of your total purchases are being driven by that search campaign. Great success?
The problem? Once you check the total number of sales, you notice they’ve increaed by only 5%. How can this be?
The attribution model suggests big impact, but in reality, you had customers already planning to buy your product. But now instead of clicking on the organic link, they clicked on the ad link. The numbers will make you think that your campaign is bringing in loads of new customers, but in reality, these people would have bought your product even without the campaign.
This is where MMM is different than attribution models. Marketing Mix Models measure incremental revenue while attribution models just assign credits.
Before you start building
Marketing mix models, as many other statistical models only work well in certain conditions, they’re not a silver bullet, but rather a single tool in your analytics arsenal. MMM is not here to replace your attribution models and A/B tests, but to augment them.
Here’s a quick MMM checklist to verify if your scale is large enough for MMM:
- Do I have at least 3 years of marketing data?
- Do I use more than 3 distinct marketing channels?
- Do my campaigns run accross different regions or markets?
- Do I have a way of extracting my marketing data?
Answering no to any of these, greatly impacts the quality of your MMM model.
Companies that benefit most from MMM are the ones whose marketing budgets exceed 6 figures.
How to build a marketing mix model
Building an MMM used to require deep stats knowledge and heavy computing. Today, tools like Google’s Meridian make it accessible.
Google Meridian is a Python-based framework built on Bayesian inference. It improves on traditional MMM designs by:
- Accounting for diminishing returns (every extra $1 has less impact).
- Handling collinearity (channels that move together).
- Modeling adstock and carryover effects (lagged impact of campaigns).
The setup is for google meridian is simple: load your data, run the model, and Meridian generates dashboards with actionable insights.
Building the technology itself isn’t hard, the hard part is collecting clean and reliable data.
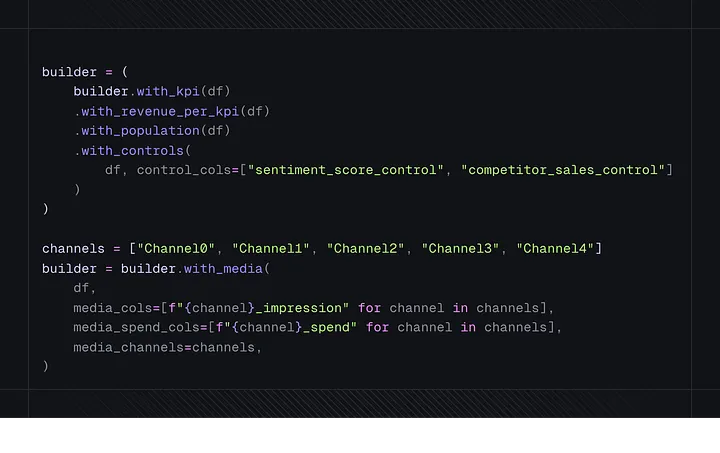
This is practically half the code you need to train an MMM using Google Meridian
Preparing the training data
As I’ve mentioned, doing the MMM training is a rather simple process. You download the Meridian library, plop in the .csv file with your training data, and after a couple of minutes you get a convenient HTML report with the results inferred by the model.
But what the model tells you is only as good as the data you provide it. In data science we call this “garbage in garbage out”. In this section I’m going to go through all of the variables you need to collect to train the model and explain why they’re used.
Don’t worry if you can’t really picture how the final spreadsheet will look like. Read through the description and at the end of the blog I’ll provide the examples, then it will all come together.
Core metrics
Exposure
For each of your marketing channels, you want to provide a metric that represents the media efforts you can control. Both impressions and clicks are a good choice here. This is something you can directly influence by changing the budget.
Spend
This one is simple, it’s how much you’re spending on each of your channels
Control Variables
These represent the world outside your marketing campaign. Economic indicators that give the model insights to how your market is behaving. Most of the time you’re going to want to use GQV (Google Query Volume) for this purpose.
Revenue
How much money you’ve made.
Additional metrics
These are not required for the training process, but are highly recommended.
Organic media exposure
How impressions or clicks are you getting from your marketing activities with no direct costs. These incldue but are not limited to: activity from newsletters, blog posts, social activity, email camapigns
Non media treatment
These are all your other marketing activities such as running promotions or drastically changing a price of a product.
Geo population
If you’re geo level data (breaking down your metrics by country) it is very useful to include the population of that geo in the metrics. This helps the model scale the values of your other metrics accordingly.
Data granularity
We’ve answered the question of what data we need, but now it’s time to ask how that data needs to be structured. This is called the data granularity. Or the level of detail in the data structure.
For MMM there are two recommendeddimensions:
Time dimension (weekly)
Each record of our training data should represent the aforementioned metrics summed up in a single week of time. Using daily data would be bad as it has too much noise, and aggregating on a higher level (like monthly) would loose us important signals.
Geo dimension
So this is not strictly required, but will highly improve your chances of getting good results. If you can, try to break down your data on the geo level. If you’re advertising in multiple countries or in multiple regions, try to get the revenue, spend, the control, for each of the markets, separately.
Gathering training data
Gathering data for MMM can be tricky, and it gets harder the more channels you have. For this reason I usually rely on third party tools to help me.
I’ve tested plenty of those, but Windsor.ai has by far been my favourite. It’s affordable and can pull data from 300+ data sources, so you’re bound to find what you need.
Use this link to get started with Windsor.ai
Windsor.ai makes it really easy to get data from anywhere to everywhere.

They also provide a ton of pre built templates and dashboard to get you started on any analytics project.
Marketing Mix Modeling Example
Another great thing about Google Meridian is that it not only simplified the training and inference process for you, it goes the extra mile and produces an easily readable report.
Understanding these tools without actually being able to see what they produce is hard, i know. That’s why I’ve already done the work of running the model so that I can share with you what that report (and the training data) looks like.
Follow this link to download the Google Meridian example data.
The end
That’s it for now, see you thank you for sticking through this blog, if you need help building your own MMM model. Feel free to reach out or book a free consulting session if you need any help working with BigQuery or meridian.
FAQ
What is Marketing Mix Modeling (MMM)?
Marketing Mix Modeling (MMM) is a statistical technique that quantifies how different marketing activities contribute to business outcomes such as revenue, conversions, or profit. It uses historical data to estimate the incremental impact of paid media, pricing, promotions, distribution, seasonality, and external factors on performance.
What do marketing mix models show advertisers?
Marketing mix models estimate the incremental contribution of each marketing channel to sales or other business KPIs. They provide metrics such as channel contribution, return on ad spend (ROAS), diminishing returns, and carryover effects (adstock), helping advertisers understand what is truly driving growth beyond baseline demand.
What can I use a marketing mix model for?
MMM is primarily used for budget allocation and strategic planning. It helps identify which channels are under-invested or over-invested, simulate different budget scenarios, forecast performance, and optimize spend to maximize revenue or profit under real-world constraints.
How do you build a marketing mix model?
Building an MMM typically involves:
- Collecting and cleaning historical data (media spend, impressions, revenue, pricing, promotions, seasonality),
- Applying transformations such as adstock and saturation curves,
- Estimating channel effects using regression or Bayesian methods,
- Validating the model through backtesting and holdout periods.
Modern open-source frameworks like Google’s Meridian and LightweightMMM can accelerate this process.
How do modern marketing mix models work?
Modern MMM approaches often rely on Bayesian inference. Instead of producing single-point estimates, Bayesian models estimate probability distributions for each channel’s impact.
This allows marketers to:
- Incorporate prior business knowledge,
- Handle noisy or limited data more robustly,
- Quantify uncertainty in ROAS estimates,
- Make risk-aware budget decisions based on probabilistic outcomes rather than fixed numbers.